The September update from the Bureau of Labor Statistics showed that U.S. inflation rate ticked down to 2.5% in August, the fifth consecutive month that it has fallen. Figure 1 shows the near round-trip taken by inflation since the beginning of the pandemic.
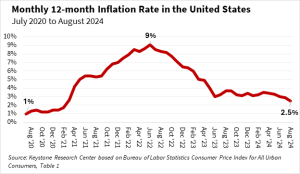
In a podcast for the Financial Times, Minneapolis Federal Reserve Bank President Neel Kashkari described how, in the pandemic, strong demand collided with weak supply and pushed up inflation across the globe. At the onset of the COVID-19 pandemic, consumers’ engagement with in-person services largely shut down. The demand for goods rose sharply. Russia’s February 2022 invasion of Ukraine further shocked the energy and food supply, and the energy shock bled into the entire economy.
Kansas City Federal Reserve Bank economists found that pandemic profiteering in the context of supply chain bottlenecks accounted for all of inflation from mid-2020 to mid-2021 and 40% of inflation from mid-2020 to mid-2021. Since then, inflation has dropped as product and labor supplies have untangled and the balance of consumer demand between goods and services has normalized.
In a global context, our current 2.5% inflation brings our rate below or even with Japan and Canada’s July inflation rates, over a full percentage point below the Netherlands and Australia, and places us at half of neighboring Mexico’s inflation rate. The U.S. inflation rate over the previous year is likely to remain below 3% in early October when the September update is announced. (We know this because the inflation increase in September 2023—which will drop out of the 12-month average—was high, and higher than the expected increase this month.)
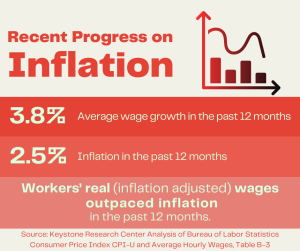
As inflation has come down, the Bureau of Labor Statistics reported last week that real wages have gone up. Over the past 12 months, average hourly wages in the U.S. private sector rose 3.8%, 1.3 percentage points more than inflation. Figure 2 shows the 2019-2023 inflation trend compared to wage growth trends for every decile of Pennsylvania earners. In short, although prices rose in that time period, the real buying power of most Pennsylvania workers outpaced inflation.
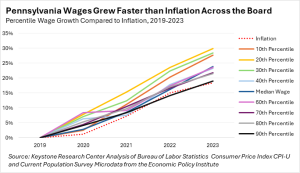
Recent robust real wage growth and progress on inflation do not take away the struggles faced by working families during the roughly 30 months in which corporate price gouging and pandemic supply bottlenecks drove inflation. Rising prices for necessities like food, gasoline, and rent hit families living paycheck-to-paycheck particularly hard. The fact that wage growth was most rapid in the bottom third of the wage distribution (the orange, yellow, and green lines in the chart above) helped.
If Pennsylvania lawmakers would pass a $15 per hour minimum wage increase like those in New York, New Jersey, and Maryland, it would further help struggling working families in our state. Full-time low-wage workers (at the 10th percentile) in three states bordering Pennsylvania receive $3,500 more in wages annually than their Pennsylvania counterparts.
At the federal level, we also need policies that will lower the cost-of-living for working families and wash away the bitter taste of decades of unequal growth. In the “State of Working Pennsylvania 2024,” we outline a policy path that will lock-in a vibrant economy with opportunity for all, and one in which all working families finally “feel” the benefits of shared prosperity
Keystone Research Center released its annual report on the economy “State of Working Pennsylvania 2024” on August 27th. This is the second of a series of blogs focused on smaller, more digestible, pieces of our report. To access the full report, including full references for this specific blog, and other “State of Working Pennsylvania” resources, please visit our 2024 State of Working Pennsylvania Resource page here.