In 2019, researchers at the Federal Reserve Bank of New York released a study of minimum wage impacts along the New York-Pennsylvania border.[1] Their study compared employment and wages across adjacent Pennsylvania and New York counties for two low-wage industries and showed how these industries were impacted during New York’s minimum wage increases that begin in 2014. The Fed researchers found that New York’s increasing minimum wage had a positive effect on average wages and no discernible effect on employment.
Pennsylvania’s Independent Fiscal Office (IFO) highlighted this report and modeled on it the IFO’s own border studies in IFO 2020-2021 and 2022-2023 reports .[2] The IFO examined employment and pay trends using the same methodology as the Federal Reserve Bank of New York authors, taking advantage of the “natural experiment” situation that occurred in border counties when one state (New York in this case) raises its minimum wage and another state (Pennsylvania) does not. (The IFO this year also did a new study of Maryland and Pennsylvania border counties after Maryland increased its minimum wage.)
Here, we update the Federal Reserve Bank researchers’ original study, extending the data analysis to Q4 2021. Figure shows shade in orange the counties in which the Fed researchers (and we) examined employment and wage trends in leisure and hospitality and in retail.
Figure 1
“Leisure and hospitality”—an employment code comprised of restaurants, bars, hotels, casinos, theatres, and other similar venues—is an expanding industry in the region. Retail trade—an employment code comprised of grocery, auto, building material, gasoline, clothing, and many other kinds of retail—has been contracting for years in this border-county region.
It is useful to focus on these industries for analysis, as low-wage workers are highly concentrated in both industries. Comparing the impact of minimum wage changes on one expanding industry and one contracting industry sheds light on potential impacts of a minimum wage increase in Pennsylvania.
In their original analysis, the Fed authors found that New York border counties’ leisure and hospitality employment growth in 2013-2017 was unaffected by minimum wage increases that occurred in that time frame. If anything, New York border counties’ employment in this industry increased relative to that in Pennsylvania border counties. The authors also found that minimum wage increases in New York did not change the retail employment trend; it had been trending downward in the border area before the New York minimum wage increases, but the rate of decline did not change. Pennsylvania retail trade employment also declined—in line with New York employment rates. Earnings in the two states, unlike employment, did diverge, rising more quickly in New York.
New York’s minimum wage has continued to increase since this first study—the New York minimum hourly wage reached $12.50 in December 2020 in rural counties bordering Pennsylvania. It increased again from $12.50 to $13.20 on December 31, 2021, but our data do not capture that most recent change. Additional annual increases in New York are planned until the rate reaches a $15 minimum wage and a $10 tipped minimum wage. The minimum wage is already $15 per hour in New York City, with Long Island and Westchester also scheduled to reach a $15 wage before the border counties in this study. Even at $13.20 per hour, minimum wage workers in New York border counties are earning an hourly wage that’s a full $5.95 or 82% higher than their Pennsylvania counterparts across the border earn for the same work.
Leisure and Hospitality Employment
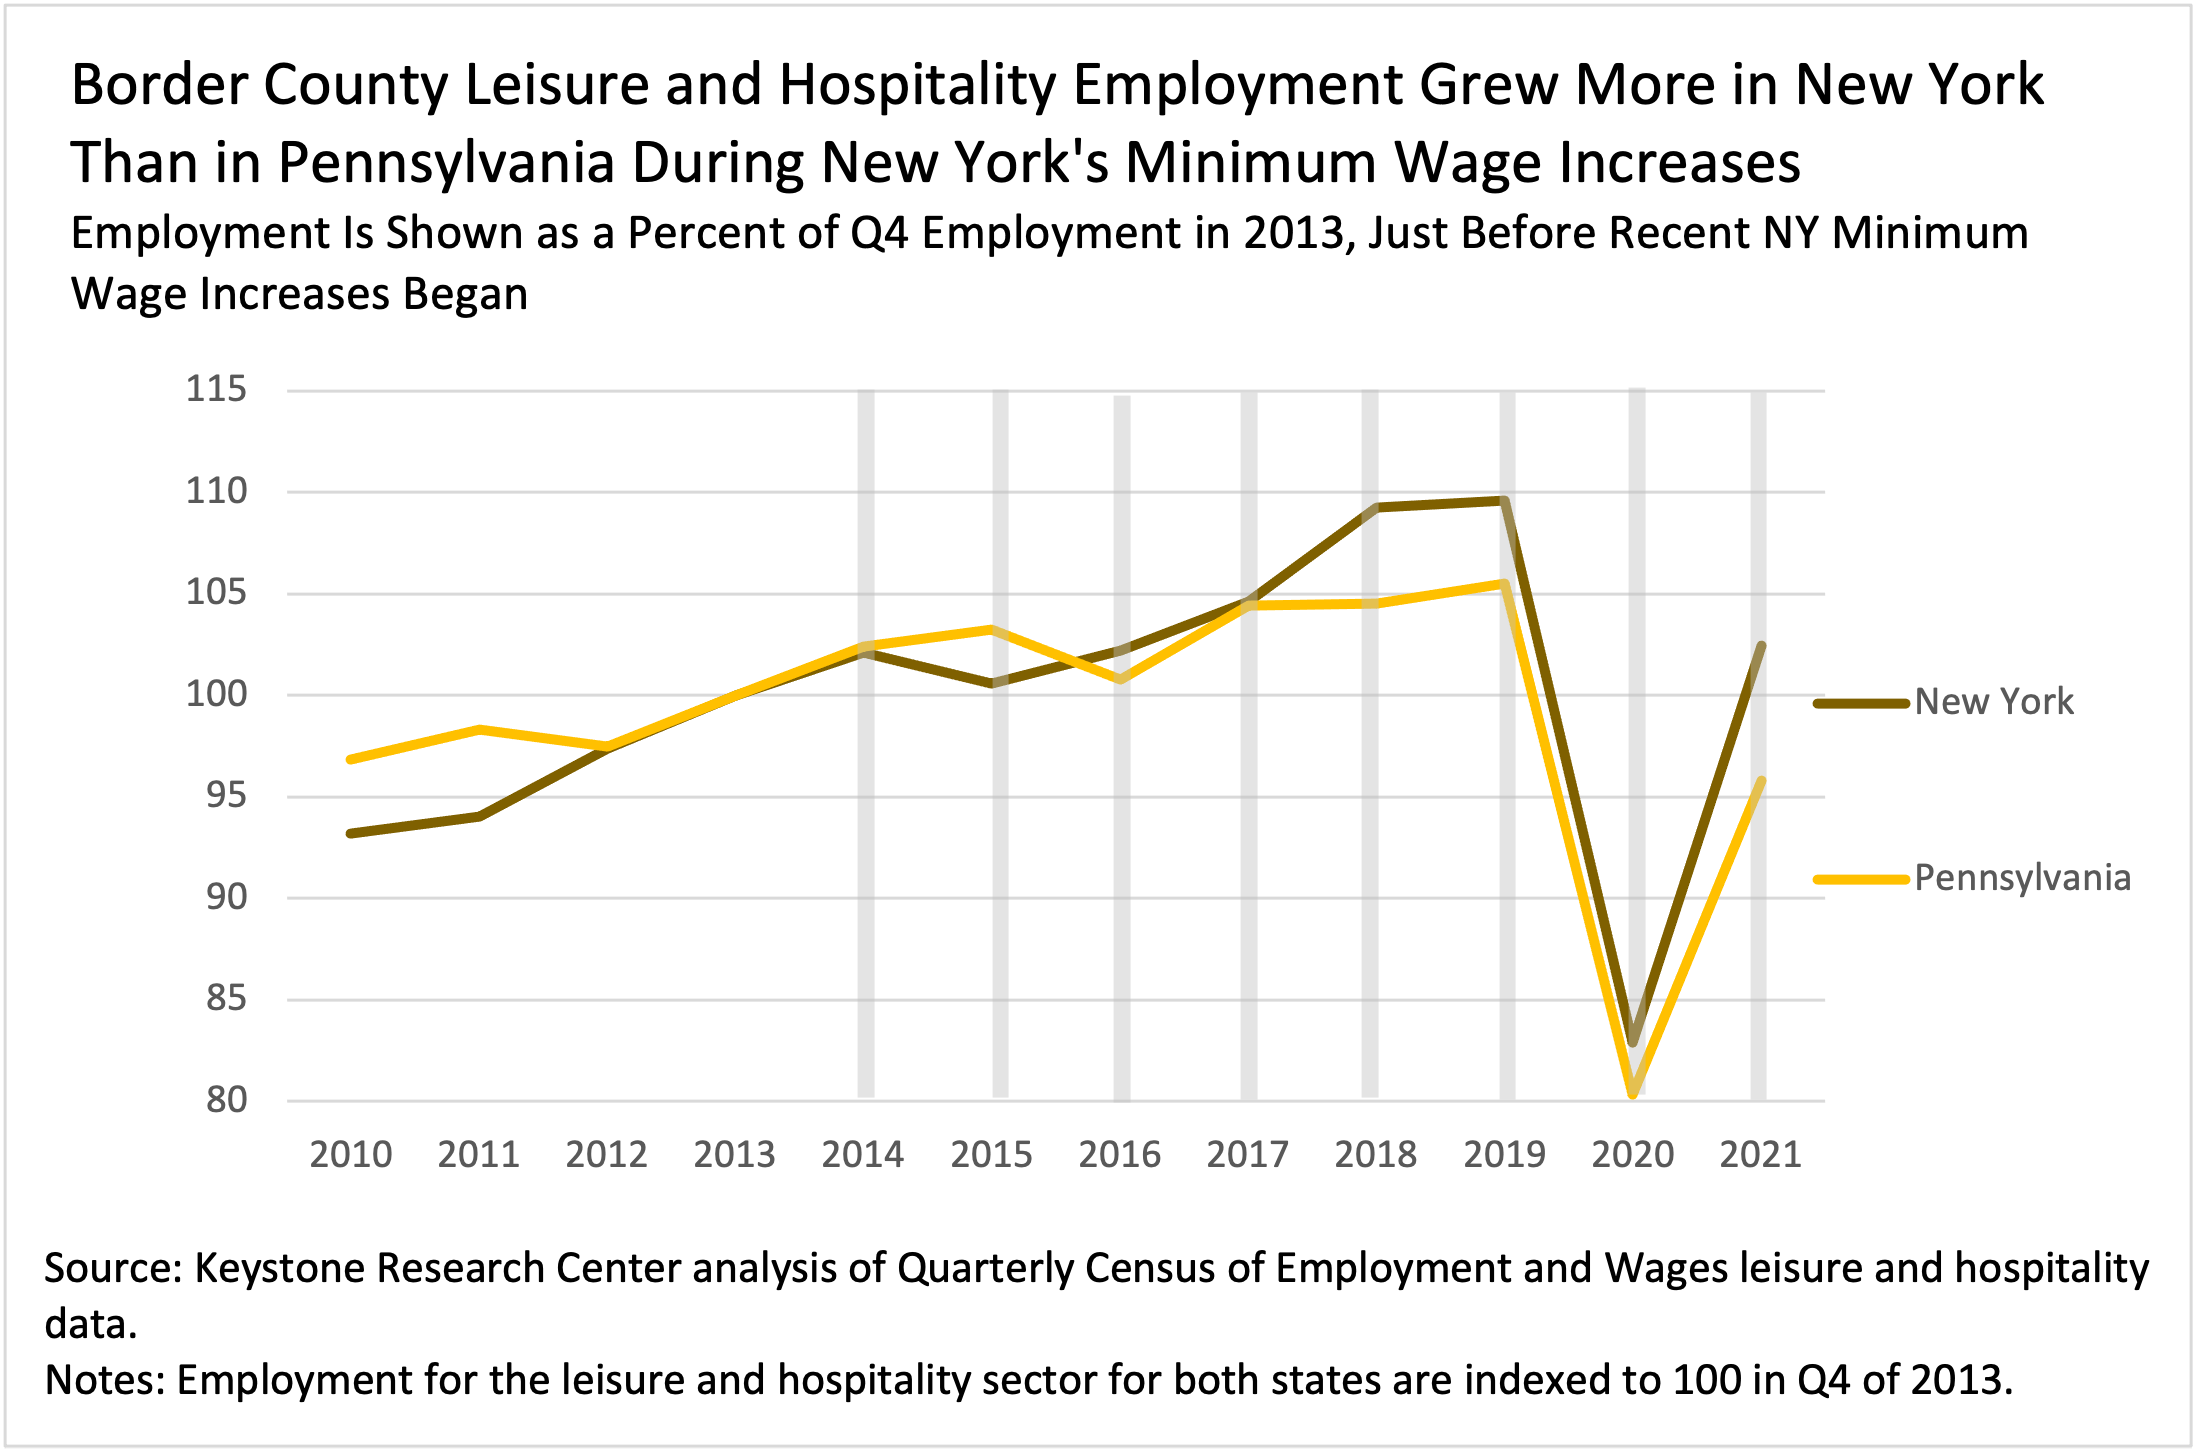
Opponents of a higher minimum wage focus especially on minimum wage increases impacts on employment of low-wage workers. We examine employment trends leading up to and through the period of minimum wage changes in New York. Figure 2 shows Pennsylvania’s and New York’s leisure and hospitality employment since 2010.
Figure 2
Figure 2 shows that, after New York started increasing its minimum wage in 2014, New York’s border county leisure and hospitality employment outpaced Pennsylvania’s in the period before the pandemic, from 2014-19. Between the fourth quarter of 2013 and the fourth quarter of 2019 (the most recent data untouched by the effects of the COVID-19 pandemic), New York border counties saw leisure and hospitality employment increase nearly 10%, compared to only 5% in Pennsylvania over the same period. Rather than minimum wage increases in New York border counties being met with adverse employment effects, employment grew faster in New York than in Pennsylvania. In both states, employment fell sharply during the initial pandemic months, both rebounding in 2021.
Leisure and Hospitality Wages
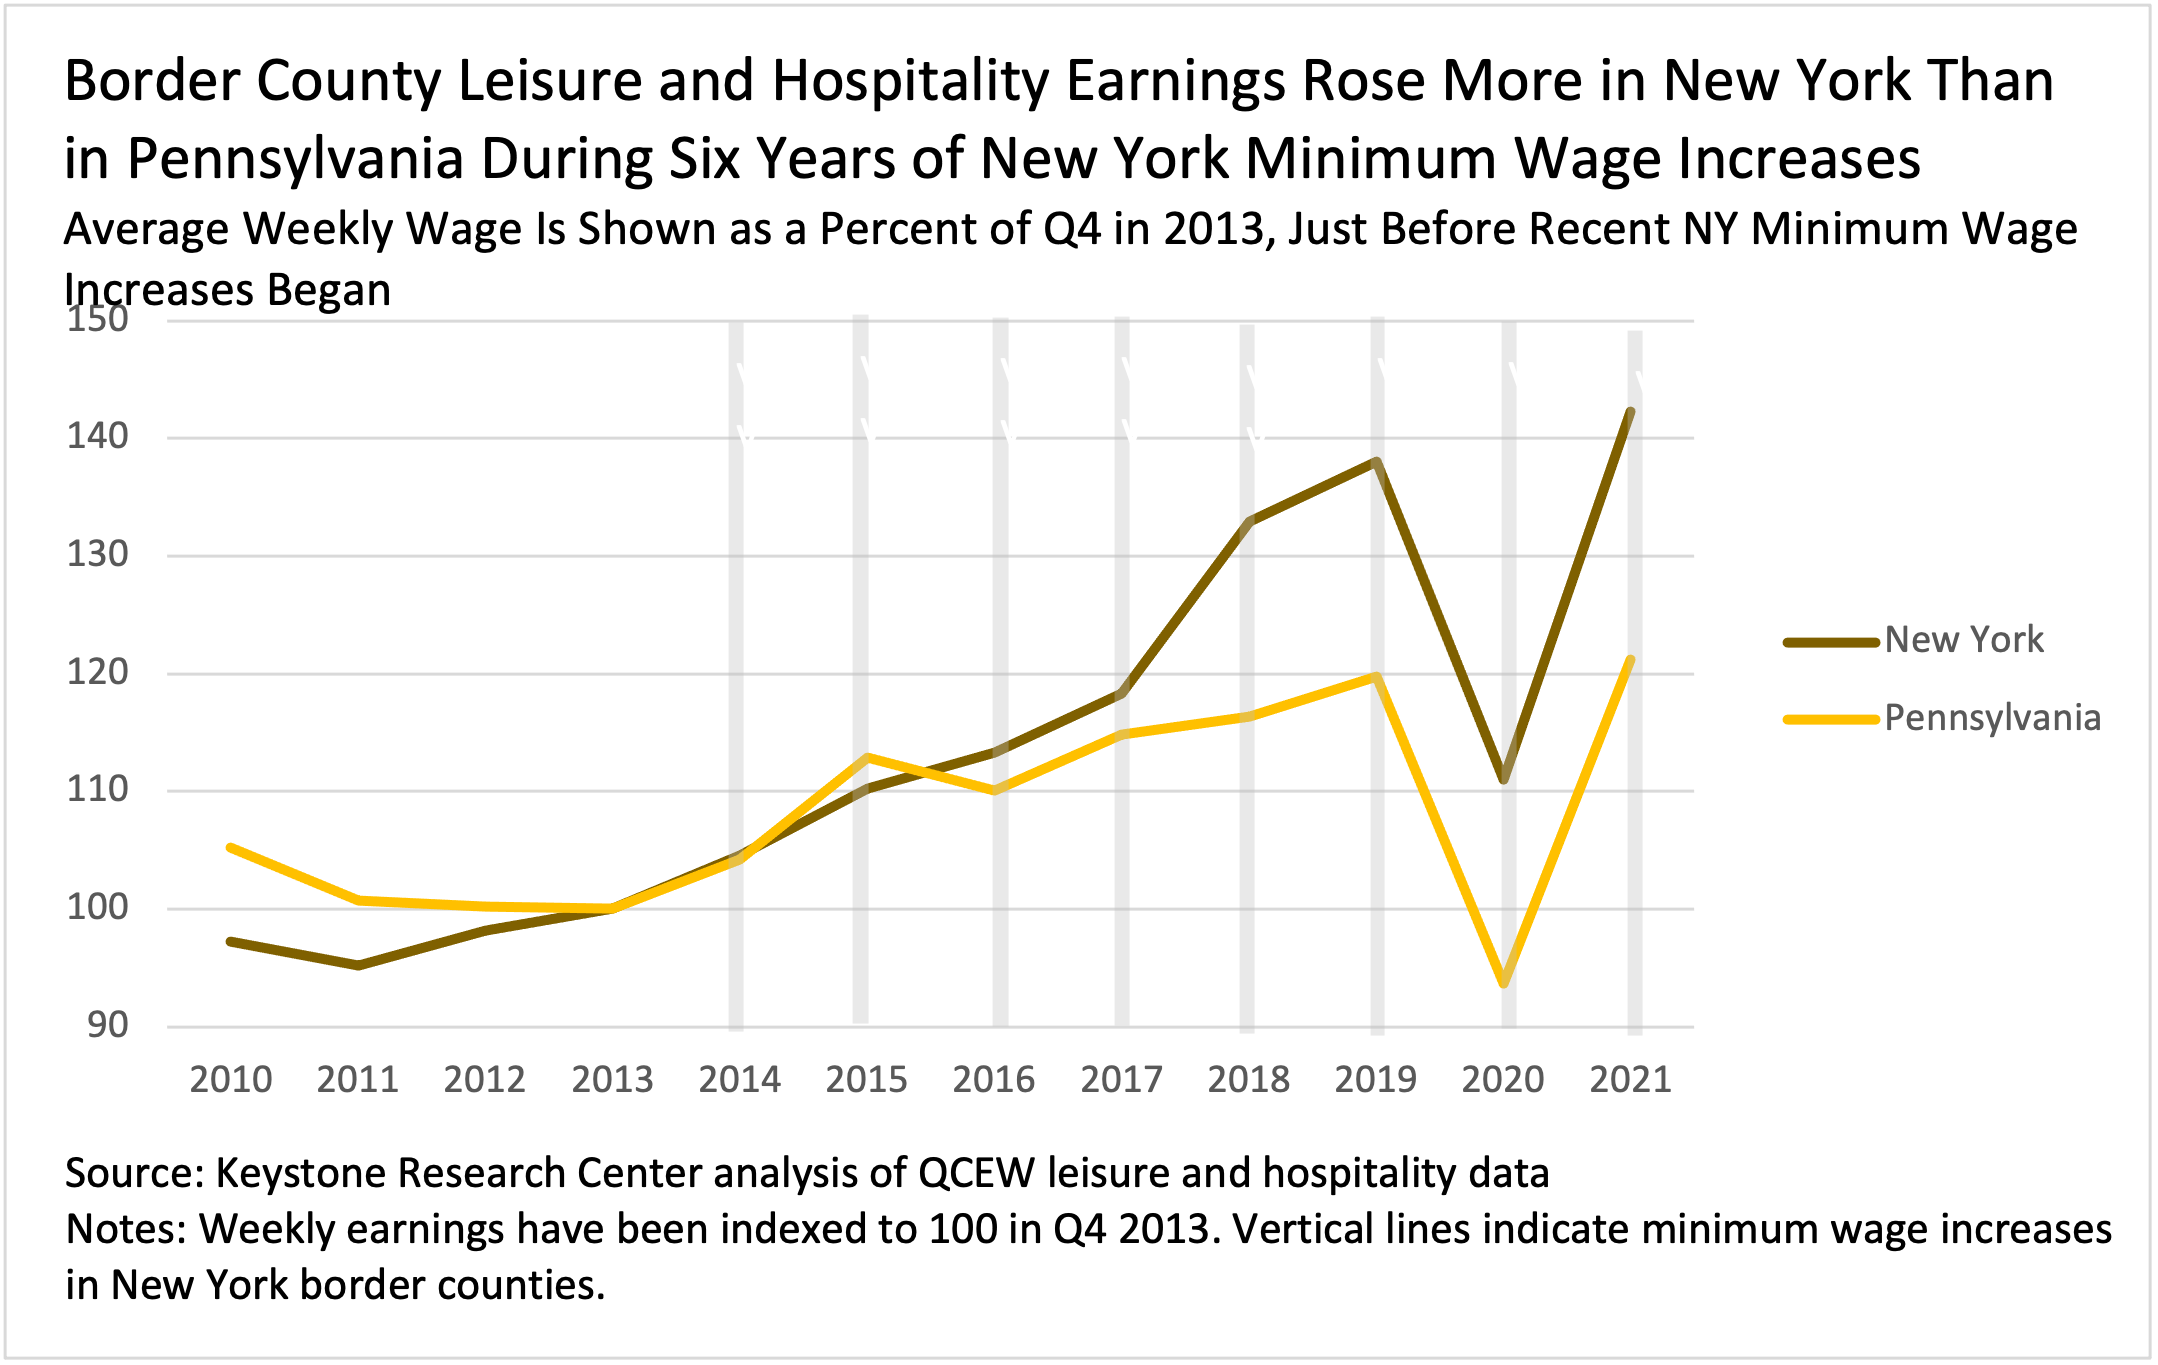
Now, following the approach again of the Federal Reserve Bank of NY economists, let’s take a look at the impact of New York minimum wage increases on average weekly income of workers in leisure and hospitality. Using fourth-quarter data starting in 2010, we examined weighted average earnings of leisure and hospitality workers in these border counties as a percent of those earnings in the fourth quarter of 2013. Figure 3 shows these results.
Figure 3
Other than a brief time in 2015, earnings in New York border counties outpaced those in Pennsylvania border counties every year; they’ve diverged significantly in recent years.
The average weekly wage of leisure and hospitality workers in New York border counties grew significantly faster than in Pennsylvania border counties after 2016. New York leisure and hospitality earnings have now increased by more than 40% since the last quarter of 2013 compared to about 20% in Pennsylvania.
The gaps in New York and Pennsylvania leisure and hospitality wages today are truly stunning: Pennsylvania workers today earn an average weekly wage of $543, while New York workers in the same industry earn an average of $881 per week.[3]
Retail Trade Employment and Wages
Turning to the retail trade industry, in both New York and Pennsylvania, employment has been contracting in these border counties in recent years. Despite the minimum wage increases in the New York border counties, retail trade employment trends in Pennsylvania and New York are the same, with New York decreasing at a slightly faster pace between Q4 2019 and Q4 2020, an acceleration that is likely due to New York’s higher COVID-19 infection rates during the first year of the pandemic.[4] Figure 4 shows the employment trends as a percent of employment in the fourth quarter of 2013.
Figure 4

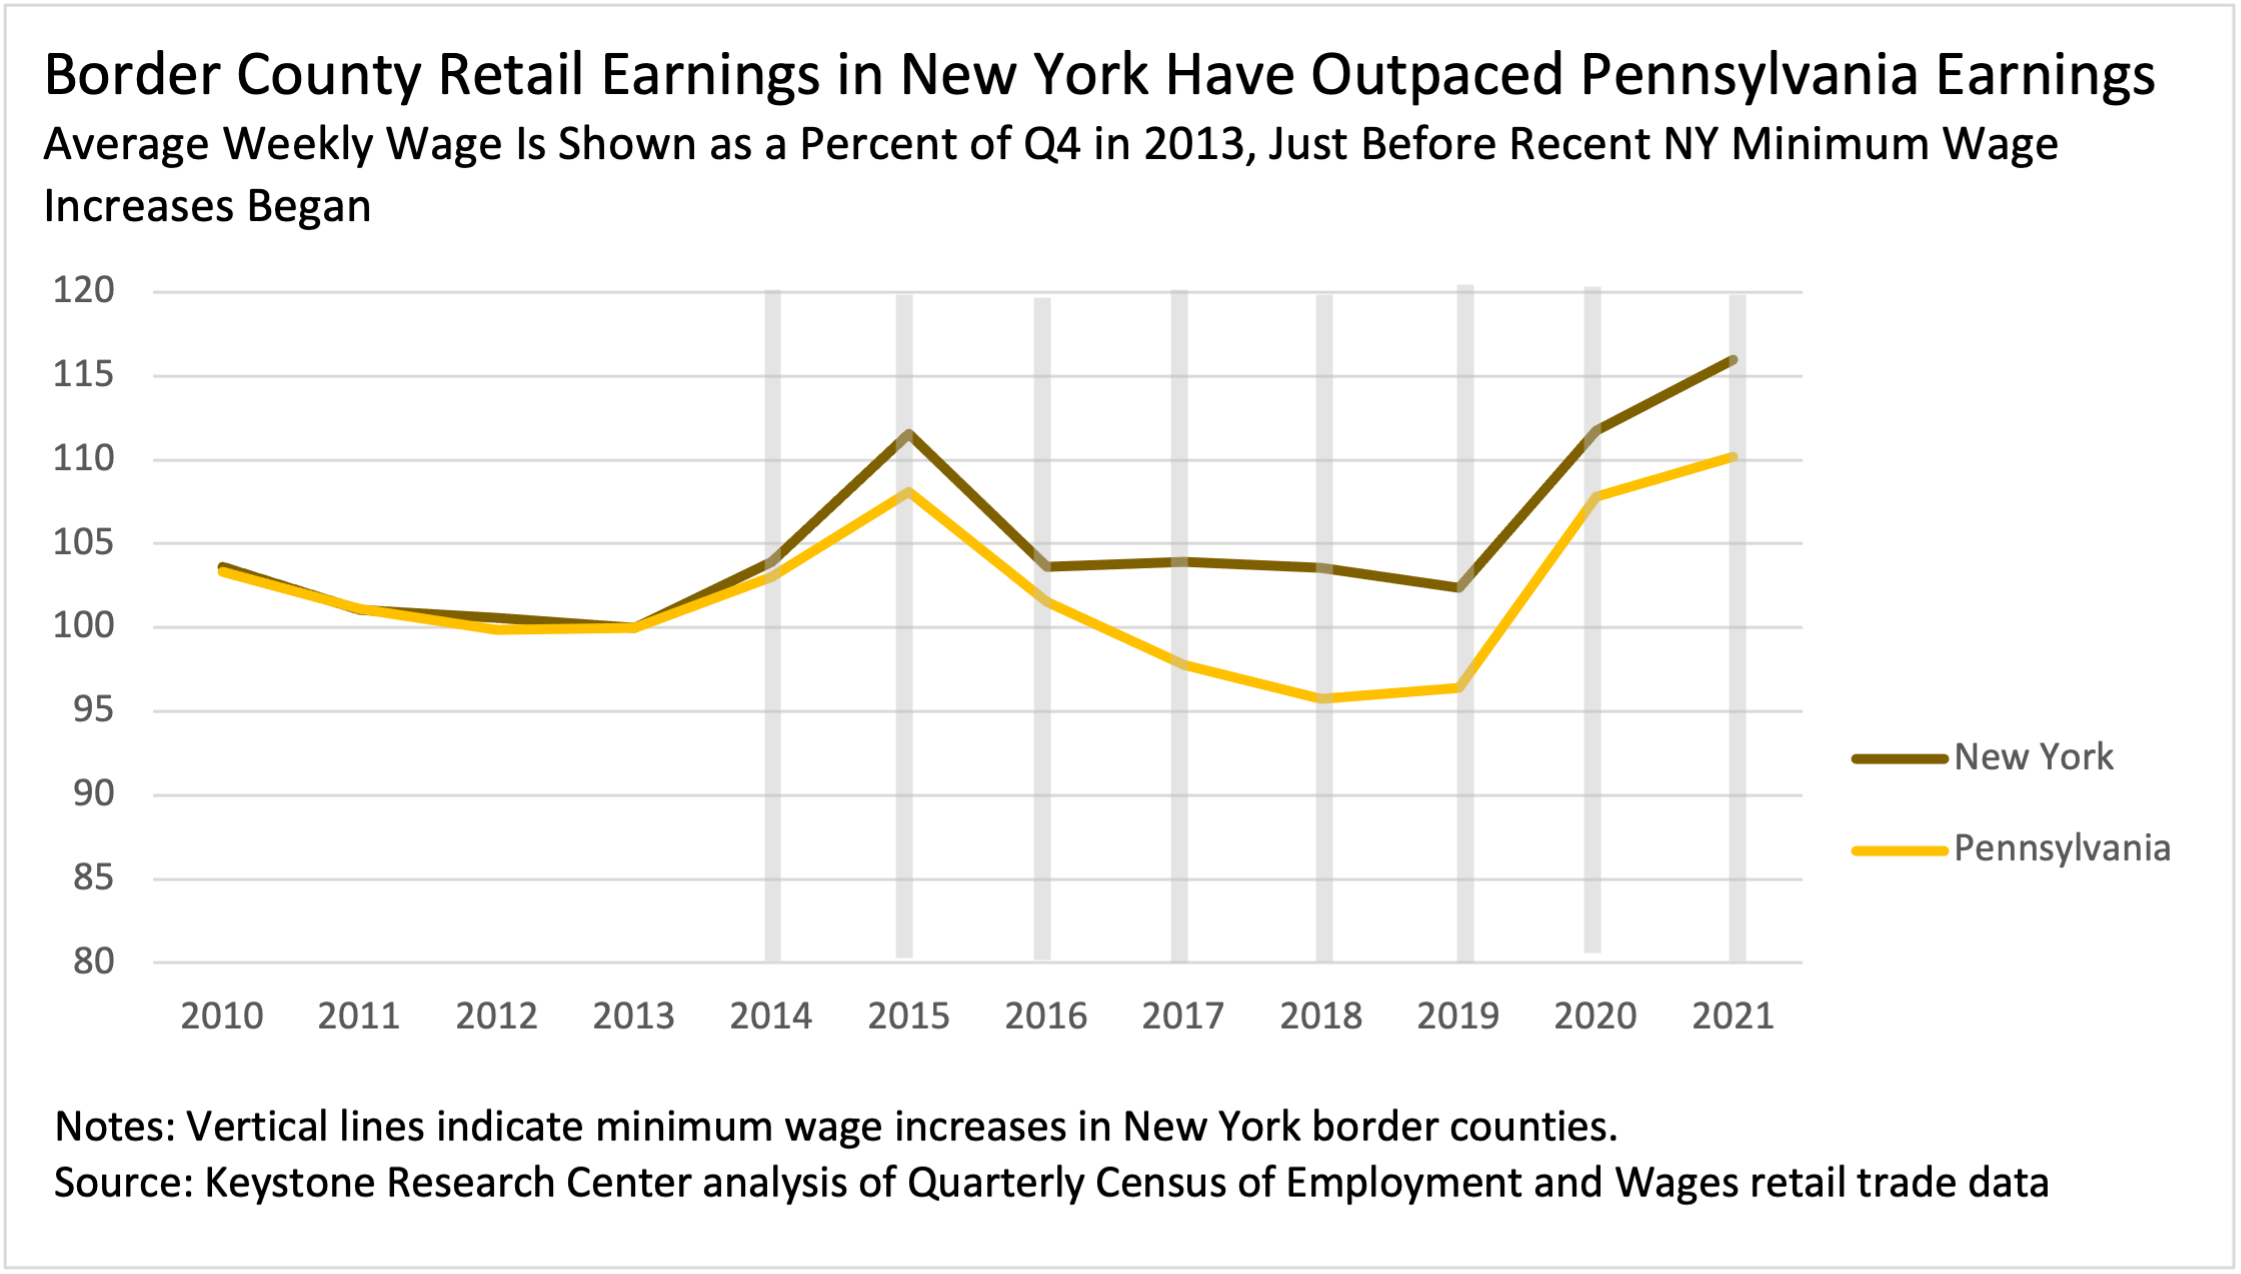
Meanwhile, retail trade wages in New York border counties outpaced those in Pennsylvania counties (Figure 5). In the most recent data available, Pennsylvania retail trade workers earn an average weekly wage of $739, while New York workers earn an average of $1,232 weekly.[5]
Figure 5
In sum, the findings in this extension of the 2019 New York Federal Reserve Bank blog on New York and Pennsylvania border counties agree with the original study. With more time passed and further increases in the New York minimum wage, employment and wage data from these industries (with high densities of minimum and low wage workers) still show positive effects on average wages coupled with no diverging trends or adverse impact on employment.
End Notes
[1] Jason Bram, Fatih Karahan, and Brendan Moore, “Minimum Wage Impacts along the New York-Pennsylvania Border,” Federal Reserve Bank of New York Liberty Street Economics, September 25, 2019, https://libertystreeteconomics.newyorkfed.org/2019/09/minimum-wage-impacts-along-the-new-york-pennsylvania-border.html.
[2] Independent Fiscal Office (IFO), “Analysis of Revenue Proposals,” April 2020, http://www.ifo.state.pa.us/download.cfm?file=Resources/Documents/Revenue-Proposal-Analysis-2020-04.pdf.
IFO, Analysis of Revenue Proposals April 2022, http://www.ifo.state.pa.us/download.cfm?file=Resources/Documents/Revenue_Proposal_Analysis_2022_04.pdf.
[3] Pennsylvania Department of Labor and Industry (DLI), Quarterly Census of Employment and Wages (QCEW), Q4 2021 data, https://paworkstats.geosolinc.com/vosnet/analyzer/resultsNew.aspx?session=ind202&plang=E&pu=1&plang=E; and New York QCEW data at https://statistics.labor.ny.gov/lsqcew.shtm.
[4] As New York City was the US epicenter of COVID-19 in mid-2020, Orange County (the NY/PA border county in New York that’s geographically closest to the epicenter) counted 162 new cases and 8,665 total cases on April 30, 2020. Pike County, the NY/PA border county in Pennsylvania that’s geographically closest to the epicenter) counted 9 new cases, and 378 total in the same time period. Early differences in COVID-19 cases spurred state-level response differences. Source: The New York Times.
[5] PA DLI, QCEW, Q4 2021 data; and NY QCEW data.


