Written Testimony of Stephen Herzenberg, Keystone Research Center to the Pennsylvania House Energy Committee Hearing on HB1260, October 5, 2025
Chair Fiedler and members of the House Energy Committee, thank you for the opportunity to provide written testimony on HB1260, the solar-ready warehouse bill.
I hold a PhD in economics from MIT and am an economist and executive director emeritus at Keystone Research Center (KRC). The mission of KRC is to promote shared prosperity and a stronger middle class.
My testimony today highlights that enacting the solar-ready warehouse bill has potential to deliver significant benefits to Pennsylvania: a big increase in our generation of low-cost solar energy and a significant number of middle-class union construction jobs concentrated in communities hungry for well-paid jobs accessible to people who do not have a four-year college degree.
A central reason that the solar-ready warehouse bill is tailor-made for Pennsylvania is that we have a big warehouse industry that has expanded in conjunction with the growth of e-commerce. As America industrialized, Pennsylvania has long had a strategic location for transportation, including trucking. Today, we are within 500 miles of about 40% of the U.S. population, within 500 miles of a similar or slightly larger share of U.S. manufacturers, and within 100 miles of the Port of New York and New Jersey, the largest port on the East Coast.
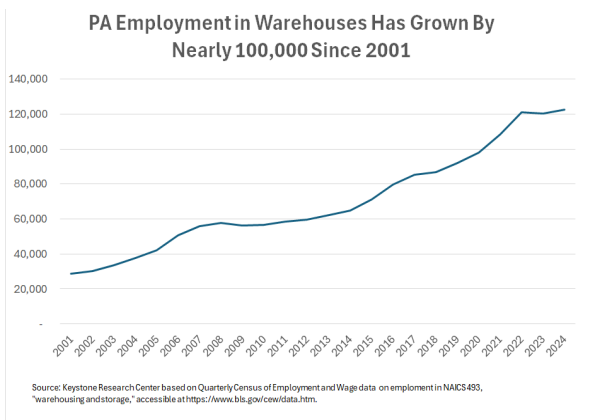
As the chart below shows, over the past quarter century, the rise of e-commerce has contributed to a truly astounding growth in warehouse jobs in Pennsylvania – a more than four-fold increase from 28,720 in 2001 to 122,432 in 2025.
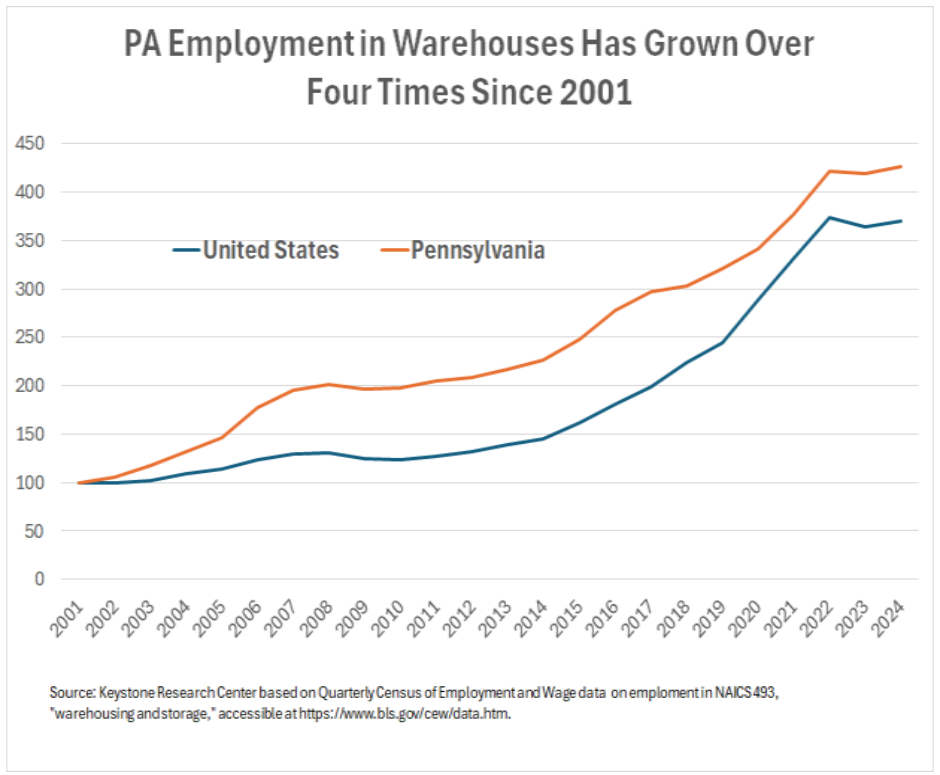
The next chart shows rapid employment growth in the warehouse industry throughout the United States but faster growth in Pennsylvania than nationally. U.S. Pennsylvania accounted for 6.5% of warehouse employment in 2024, well above our 3.9% share of U.S. non-farm jobs.
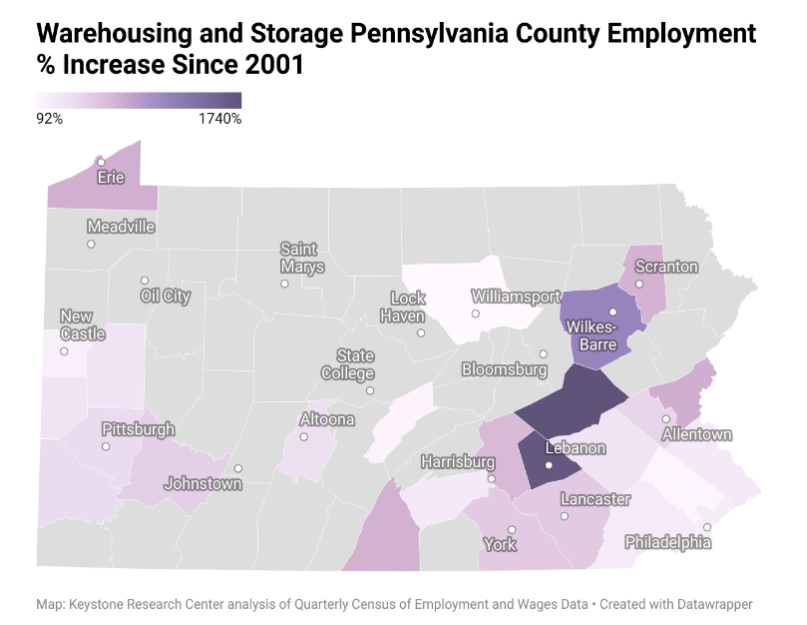
The map below and, in more detail, the interactive map at this link (Warehousing and Storage County Employment % Increase Since 2001), show the percentage employment increase by county since 2001. The biggest increases were in countries along Route 81: 1740% in Schuylkill, 1677% in Lebanon, 1148% in Luzerne, and 693% to 800% in Scranton, Dauphin, Franklin, Northampton, and Lackawanna. Many of these counties along I-81 in NE Pennsylvania lost significant numbers of manufacturing jobs in the 1980s and again in the early 2000s. They responded, in part, by helping warehouse developers access economic development subsidies (e.g., Pennsylvania Industrial Development Authority (PIDA) loans). These warehouse jobs usually paid well below past manufacturing jobs. Still today, these parts of Pennsylvania need more high-paying jobs for non-college workers. Warehouse rooftop solar construction can provide some of these jobs.
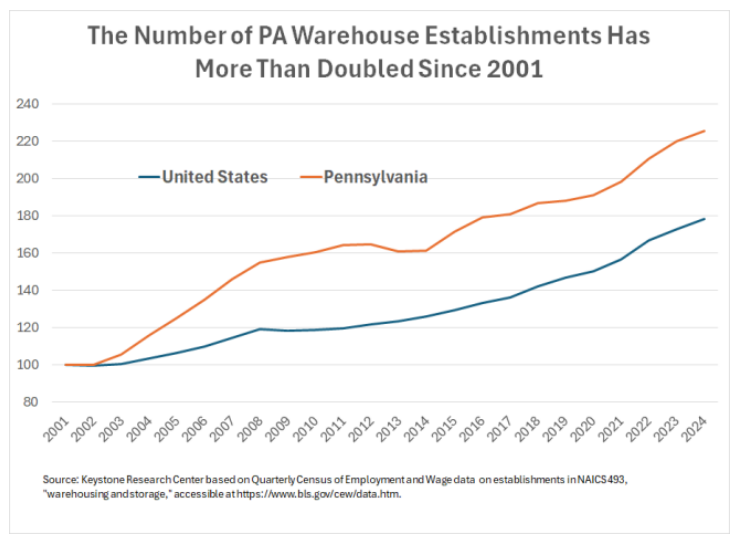
The number of warehouse establishments in Pennsylvania has also increased a lot in Pennsylvania – by slightly over 220% compared to the roughly 180% increase nationally.
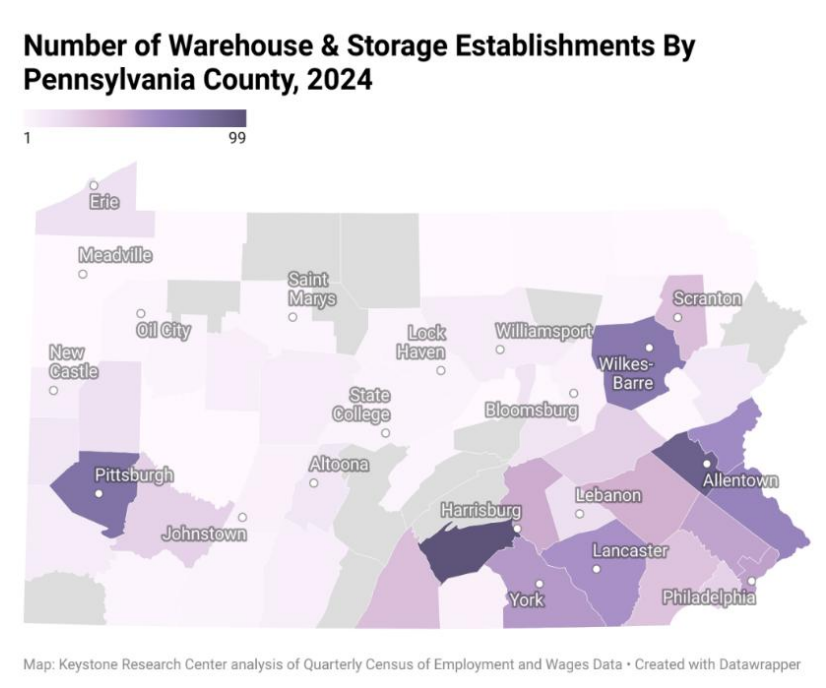
The next map, also accompanies by an interactive online map (at https://datawrapper.dwcdn.net/orTSn/1/) shows the number of warehouse establishments by county in 2024. (Further, appendix tables show the number of establishments and employment by county, along with their increases since 2001 and the share of the total number of establishments in the state and total employment in the state in 2024.) Cumberland County has the most warehouse establishments (99), Lehigh County the second most (90), Allegheny (72), Luzerne (72), Bucks (64), and Northampton, Lancaster, and York each more than 50.
As the sponsors of HB 1260 highlight, warehouses in Pennsylvania can be leveraged to
address a challenge that many Pennsylvanians face: rising energy costs, lowering utility bills, while also creating high-paying jobs.
Keystone Research Center is in the process of generating an estimate of the potential electricity generation from solar on warehouses. At this juncture, we have a preliminary estimate that is subject to revision. In 2023, the Environment America Research and Policy Center estimated that solar on warehouses could generate a potential 8,384 Gigawatt hours (GWh) of electricity annually in Pennsylvania, the seventh largest amount in the nation, generating energy for 821,000 households.[1] This estimate was based on a 2016 study, since which the number of warehouses in Pennsylvania has increased by 25%.[2] Increasing the 8,384 by 25%, warehouses have the potential to generate 10,480 GWh, satisfying 7.3% of Pennsylvania’s energy needs in 2022 according to the Pennsylvania Utility Commission.[3]
Appendix Table A1
| Warehouse and Storage Establishments and Employment by PA County (listed alphabetically) | |||||||
| Number of Establishments | Employment | ||||||
| Annual
2024 |
Share of 2024 PA Total | Increase Since 2001 (#) | Increase Since 2001 (%) | Annual
2024 |
Share of 2024 PA Total | Increase Since 2001 (%) | |
| Pennsylvania | 1139 | 100.0% | 634 | 226% | 122432 | 100.0% | 426% |
| Adams | 6 | 0.5% | 430 | 0.4% | |||
| Allegheny | 77 | 6.8% | 30 | 15% | 5595 | 3.4% | 429% |
| Armstrong | 1 | 0.1% | |||||
| Beaver | 13 | 1.1% | 7 | 3% | 276 | 0.2% | 329% |
| Bedford | 7 | 0.6% | |||||
| Berks | 41 | 3.6% | 22 | 8% | 6346 | 3.9% | 326% |
| Blair | 13 | 1.1% | 6 | 3% | 1060 | 0.8% | 391% |
| Bradford | 2 | 0.2% | 2 | 0% | |||
| Bucks | 64 | 5.6% | 38 | 13% | 3432 | 1.9% | 257% |
| Butler | 17 | 1.5% | 13 | 3% | 666 | 0.5% | 326% |
| Cambria | 6 | 0.5% | 185 | 0.1% | |||
| Carbon | 2 | 0.2% | |||||
| Centre | 4 | 0.4% | 67 | 0.1% | |||
| Chester | 32 | 2.8% | 16 | 6% | 1404 | 1.2% | 241% |
| Clarion | 4 | 0.4% | |||||
| Clearfield | 8 | 0.7% | |||||
| Clinton | 4 | 0.4% | |||||
| Columbia | 5 | 0.4% | 1284 | 1.0% | |||
| Crawford | 1 | 0.1% | |||||
| Cumberland | 99 | 8.7% | 64 | 20% | 12797 | 10.6% | 270% |
| Dauphin | 43 | 3.8% | 27 | 9% | 4322 | 3.5% | 693% |
| Delaware | 25 | 2.2% | 17 | 5% | 698 | 0.6% | 256% |
| Elk | 3 | 0.3% | 3 | 1% | |||
| Erie | 17 | 1.5% | 11 | 3% | 467 | 0.3% | 778% |
| Fayette | 3 | 0.3% | |||||
| Franklin | 34 | 3.0% | 25 | 7% | 6424 | 4.7% | 759% |
| Fulton | 0.0% | 0 | 0% | 0.0% | |||
| Greene | 0.0% | 0 | 0% | 0.0% | |||
| Huntingdon | 0.0% | ||||||
| Indiana | 1 | 0.1% | 1 | 0% | |||
| Jefferson | 7 | 0.6% | 7 | 1% | 78 | 0.1% | |
| Juniata | 0.0% | 0 | 0% | ||||
| Lackawanna | 34 | 3.0% | 15 | 7% | 4793 | 3.4% | 745% |
| Lancaster | 56 | 4.9% | 29 | 11% | 6961 | 6.1% | 563% |
| Lawrence | 8 | 0.7% | 4 | 2% | 72 | 0.1% | 195% |
| Lebanon | 18 | 1.6% | 11 | 4% | 3219 | 2.5% | 1677% |
| Lehigh | 90 | 7.9% | 60 | 18% | 10091 | 10.9% | 471% |
| Luzerne | 72 | 6.3% | 56 | 14% | 13706 | 12.1% | 1148% |
| Lycoming | 9 | 0.8% | 2 | 2% | 335 | 0.1% | 92% |
| McKean | 0.0% | 0.0% | |||||
| Mercer | 1 | 0.1% | -5 | 0% | |||
| Mifflin | 3 | 0.3% | -1 | 1% | 34 | 162% | |
| Monroe | 11 | 1.0% | 1740 | 1.5% | |||
| Montgomery | 47 | 4.1% | 21 | 9% | 1669 | 1.5% | 130% |
| Montour | 2 | 0.2% | 2 | 0% | |||
| Northampton | 59 | 5.2% | 44 | 12% | 9295 | 8.6% | 780% |
| Northumberland | 14 | 1.2% | 900 | 0.8% | |||
| Perry | 0.0% | 0.0% | |||||
| Philadelphia | 48 | 4.2% | 17 | 10% | 4865 | 3.3% | 234% |
| Pike | 0.0% | 0.0% | |||||
| Potter | 0.0% | 0.0% | |||||
| Schuylkill | 26 | 2.3% | 19 | 5% | 4612 | 3.9% | 1740% |
| Snyder | 0.0% | 0 | 0% | 0.0% | |||
| Somerset | 4 | 0.4% | |||||
| Sullivan | 0.0% | 0 | 0% | 0.0% | |||
| Susquehanna | 1 | 0.1% | 1 | 0% | |||
| Tioga | 1 | 0.1% | |||||
| Union | 1 | 0.1% | 1 | 0% | |||
| Venango | 3 | 0.3% | 3 | 1% | 0.1% | ||
| Warren | 1 | 0.1% | 1 | 0% | |||
| Washington | 9 | 0.8% | 0 | 2% | 392 | 0.3% | 417% |
| Wayne | 1 | 0.1% | |||||
| Westmoreland | 25 | 2.2% | 12 | 5% | 2420 | 2.0% | 524% |
| Wyoming | 3 | 0.3% | |||||
| York | 52 | 4.6% | 31 | 10% | 7568 | 5.8% | 564% |
| Source: Keystone Research Center based on Quarterly Census of Employment and Wage data on NAICS 493, “warehousing and storage,” accessible at https://www.bls.gov/cew/data.htm. | |||||||
Appendix Table A2
| Warehouse and Storage Establishments and Employment by PA County
(listed from most to fewest establishments in 2024) |
|||||||
| Number of Establishments | Employment | ||||||
| Annual
2024 |
Share of 2024 PA Total | Increase Since 2001 (#) | Increase Since 2001 (%) | Annual
2024 |
Share of 2024 PA Total | Increase Since 2001 (%) | |
| Pennsylvania | 1139 | 100.0% | 634 | 226% | 122432 | 100.0% | 426% |
| Cumberland | 99 | 8.7% | 64 | 20% | 12797 | 10.6% | 270% |
| Lehigh | 90 | 7.9% | 60 | 18% | 10091 | 10.9% | 471% |
| Allegheny | 77 | 6.8% | 30 | 15% | 5595 | 3.4% | 429% |
| Luzerne | 72 | 6.3% | 56 | 14% | 13706 | 12.1% | 1148% |
| Bucks | 64 | 5.6% | 38 | 13% | 3432 | 1.9% | 257% |
| Northampton | 59 | 5.2% | 44 | 12% | 9295 | 8.6% | 780% |
| Lancaster | 56 | 4.9% | 29 | 11% | 6961 | 6.1% | 563% |
| York | 52 | 4.6% | 31 | 10% | 7568 | 5.8% | 564% |
| Philadelphia | 48 | 4.2% | 17 | 10% | 4865 | 3.3% | 234% |
| Montgomery | 47 | 4.1% | 21 | 9% | 1669 | 1.5% | 130% |
| Dauphin | 43 | 3.8% | 27 | 9% | 4322 | 3.5% | 693% |
| Berks | 41 | 3.6% | 22 | 8% | 6346 | 3.9% | 326% |
| Franklin | 34 | 3.0% | 25 | 7% | 6424 | 4.7% | 759% |
| Lackawanna | 34 | 3.0% | 15 | 7% | 4793 | 3.4% | 745% |
| Chester | 32 | 2.8% | 16 | 6% | 1404 | 1.2% | 241% |
| Schuylkill | 26 | 2.3% | 19 | 5% | 4612 | 3.9% | 1740% |
| Delaware | 25 | 2.2% | 17 | 5% | 698 | 0.6% | 256% |
| Westmoreland | 25 | 2.2% | 12 | 5% | 2420 | 2.0% | 524% |
| Lebanon | 18 | 1.6% | 11 | 4% | 3219 | 2.5% | 1677% |
| Butler | 17 | 1.5% | 13 | 3% | 666 | 0.5% | 326% |
| Erie | 17 | 1.5% | 11 | 3% | 467 | 0.3% | 778% |
| Northumberland | 14 | 1.2% | 900 | 0.8% | |||
| Beaver | 13 | 1.1% | 7 | 3% | 276 | 0.2% | 329% |
| Blair | 13 | 1.1% | 6 | 3% | 1060 | 0.8% | 391% |
| Monroe | 11 | 1.0% | 1740 | 1.5% | |||
| Lycoming | 9 | 0.8% | 2 | 2% | 335 | 0.1% | 92% |
| Washington | 9 | 0.8% | 0 | 2% | 392 | 0.3% | 417% |
| Clearfield | 8 | 0.7% | |||||
| Lawrence | 8 | 0.7% | 4 | 2% | 72 | 0.1% | 195% |
| Bedford | 7 | 0.6% | |||||
| Jefferson | 7 | 0.6% | 7 | 1% | 78 | 0.1% | |
| Adams | 6 | 0.5% | 430 | 0.4% | |||
| Cambria | 6 | 0.5% | 185 | 0.1% | |||
| Columbia | 5 | 0.4% | 1284 | 1.0% | |||
| Centre | 4 | 0.4% | 67 | 0.1% | |||
| Clarion | 4 | 0.4% | |||||
| Clinton | 4 | 0.4% | |||||
| Somerset | 4 | 0.4% | |||||
| Elk | 3 | 0.3% | 3 | 1% | |||
| Fayette | 3 | 0.3% | |||||
| Mifflin | 3 | 0.3% | -1 | 1% | 34 | 162% | |
| Venango | 3 | 0.3% | 3 | 1% | 0.1% | ||
| Wyoming | 3 | 0.3% | |||||
| Bradford | 2 | 0.2% | 2 | 0% | |||
| Carbon | 2 | 0.2% | |||||
| Montour | 2 | 0.2% | 2 | 0% | |||
| Armstrong | 1 | 0.1% | |||||
| Crawford | 1 | 0.1% | |||||
| Indiana | 1 | 0.1% | 1 | 0% | |||
| Mercer | 1 | 0.1% | -5 | 0% | |||
| Susquehanna | 1 | 0.1% | 1 | 0% | |||
| Tioga | 1 | 0.1% | |||||
| Union | 1 | 0.1% | 1 | 0% | |||
| Warren | 1 | 0.1% | 1 | 0% | |||
| Wayne | 1 | 0.1% | |||||
| Fulton | 0.0% | 0 | 0% | 0.0% | |||
| Greene | 0.0% | 0 | 0% | 0.0% | |||
| Huntingdon | 0.0% | ||||||
| Juniata | 0.0% | 0 | 0% | ||||
| McKean | 0.0% | 0.0% | |||||
| Perry | 0.0% | 0.0% | |||||
| Pike | 0.0% | 0.0% | |||||
| Potter | 0.0% | 0.0% | |||||
| Snyder | 0.0% | 0 | 0% | 0.0% | |||
| Sullivan | 0.0% | 0 | 0% | 0.0% | |||
| Source: Keystone Research Center based on Quarterly Census of Employment and Wage data on NAICS 493, “warehousing and storage,” accessible at https://www.bls.gov/cew/data.htm. | |||||||
[1] https://environmentamerica.org/center/resources/solar-on-warehouses/
[2] https://docs.nrel.gov/docs/fy16osti/65298.pdf
[3] https://www.puc.pa.gov/media/2527/electric-power-outlook-for-pennsylvania-2022-2027-8-29-2023-final-draft-with-covers.pdf